
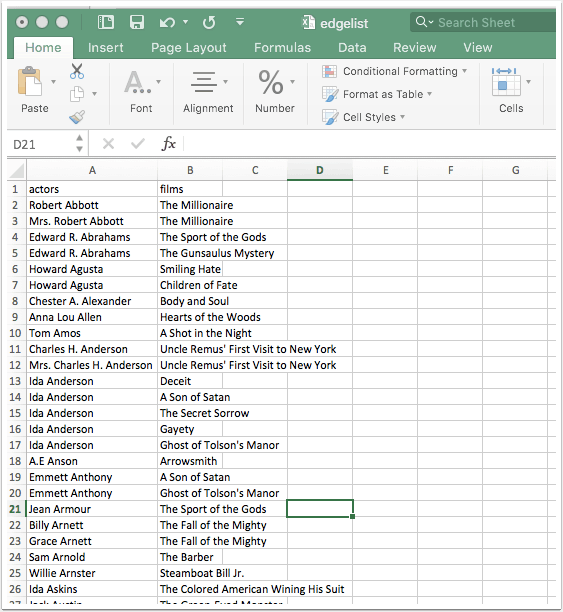
The most important thing to understand about Cytoscape (or, really, most network analysis tools) is the format in which you need to structure your data. At its most basic, Cytoscape wants a spreadsheet containing two columns. The objects in the first column should be connected in some way to the objects in the second column. This is called an edge list. In the example below, my edge list contains two kinds of things: films and actors. The columns could be reordered so that the Films column precedes the Actors column; it doesn't matter. All that matters here is that each row in my spreadsheet describes a connection between two entities.
Other kinds of relationships you could describe in an edge list:
• Actor A appears in a film with Actor B.
• Person A possesses a preference for Thing A.
• Person A shares a preference with Person B.
• Film A shares an actor with Film B.
• Person A wrote Book A.
... and on and on. The important thing here is that your edge list should contain a list of relationships between, at most, two kinds of entities (e.g., actors and films, people and preferences, people and books). The nature of those relationships can differ. For example, Person A could have written Book A, while Person B published Book A. But there should be two different kinds of things, at most, described in two columns.
If you need specific guidance on setting up your edge list, see Preparing Data 1: Making an Edge List.
You can save your spreadsheet as an Excel document (with the file extension .xls) or its generic equivalent, a CSV (with the file extension .csv). Cytoscape can interpret both of these formats.
If you don't have your own data, you can use the sample edgelist included in this tutorial.
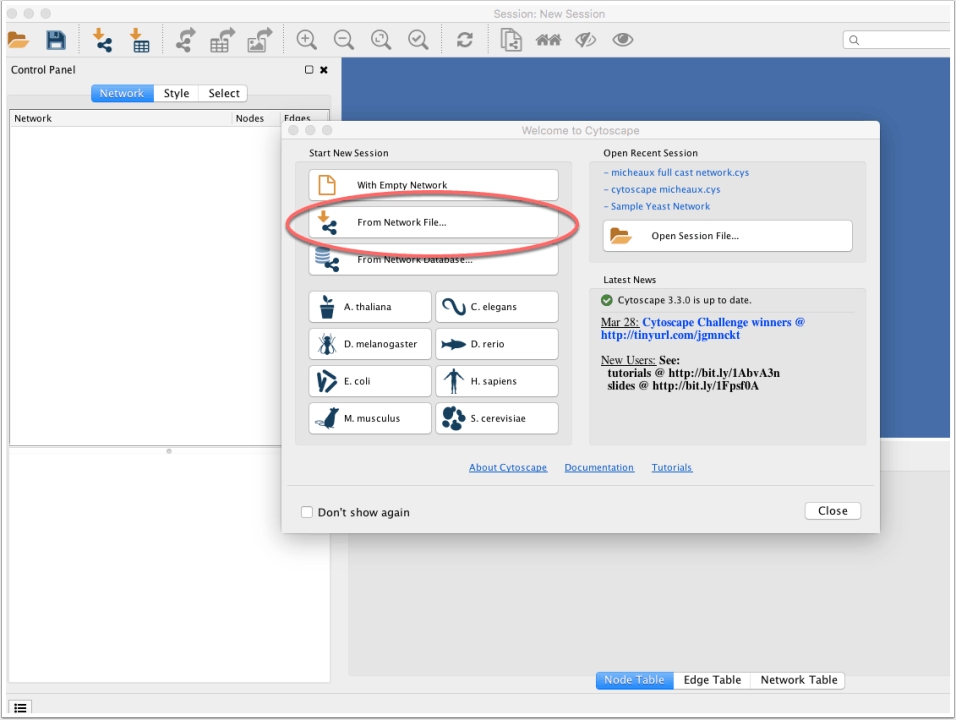
Open up Cytoscape. You should be greeted with a welcome pane that looks something like the one below. (If not, read on for instructions on how to accomplish the same thing without the welcome screen.)
Start a new session From Network File. Somewhat confusingly, Cytoscape considers your edge list a "network file." I guess it is a network, so maybe it's not that confusing. Anyway, press the From Network File button and select the edge list you've prepared.
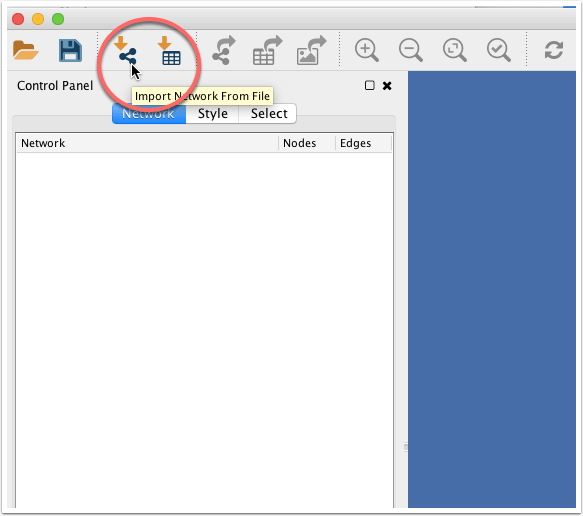
No big deal. Someone might have disabled it, but you can accomplish the same thing by clicking on the Import Network from File button (circled below) and selecting your edge list.
The screen that pops up after you imported your edge list might be the most initially confusing part of Cytoscape, although it's no problem once you figure out what it wants. You need to tell Cytoscape which parts of your data constitute the entities in your network diagram.
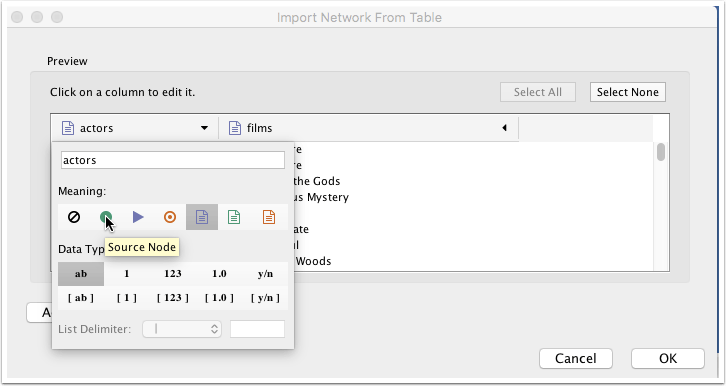
Cytoscape hasn't understood right away that you want a network composed of film and actor nodes. You can tell that's the case because the icon that appears next to the words actors and films looks sort of like a document, which means that Cytoscape thinks that you've fed it a list of edge attributes, not edges themselves. Edge attributes can come in handy, as I'll explain below, but that's not what you've provided Cytoscape at the moment.
We need to tell Cytoscape that the edge list we've provided contains Sources in one column and Targets in another. It doesn't matter, in this case, which column you designate a source and which column you designate a target; it's just that one column has to be one and the other has to be the other. (If our network was directed, this would matter, but that's more information than you need right now.)
OK, let's tell Cytoscape how to interpret our data. Click on the arrow next to the word actors and from the menu that appears, select the green circle. Cryptically, this icon means Source. For the films column, do the same thing, but this time select the red bullseye, which means Target.
When you've changed both columns, click OK.
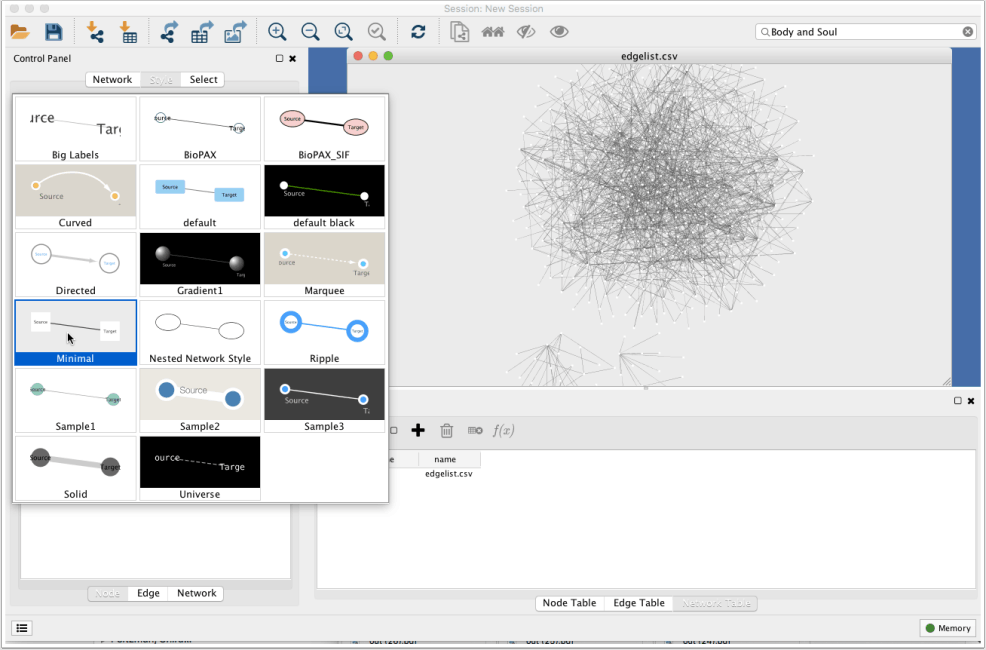
One of the easiest ways to change the look of your network diagram is to switch the style using one of Cytoscape's built-in options. To do that, click the Style tab on the control panel and then choose one of the options with which you're presented. I don't know if I love any of them, but some are more legible than others.
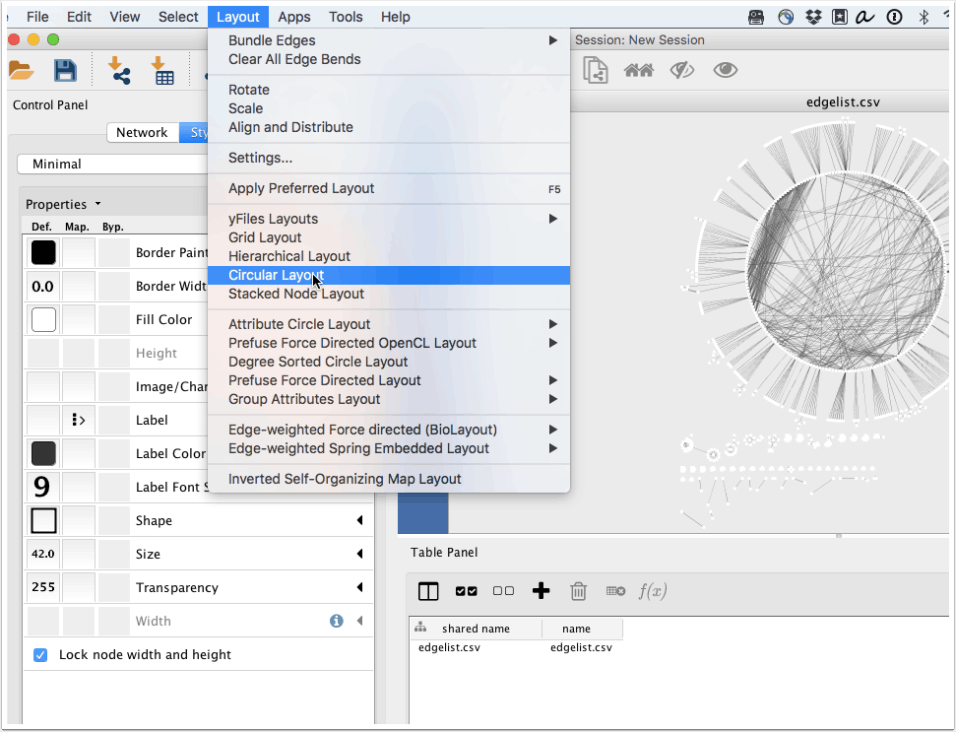
Sometimes networks are more legible if you change the arrangement of the nodes. You can do this by switching the layout. Click on Layout from Cytoscape's menu bar and select one of the layout options. Experiment with various layouts and notice how drastically your network diagram changes.
Confoundingly, each of these wildly different network layouts displays the same basic information. How can this be? Simple: In most network graphs, the proximity of two nodes doesn't indicate anything except legibility. This can be really confusing, because cognitively, we expect proximity to convey meaningful information. It just doesn't, though, in most network diagrams. The presence or absence of an edge means something, and color and size often do, too. But proximity generally doesn't.
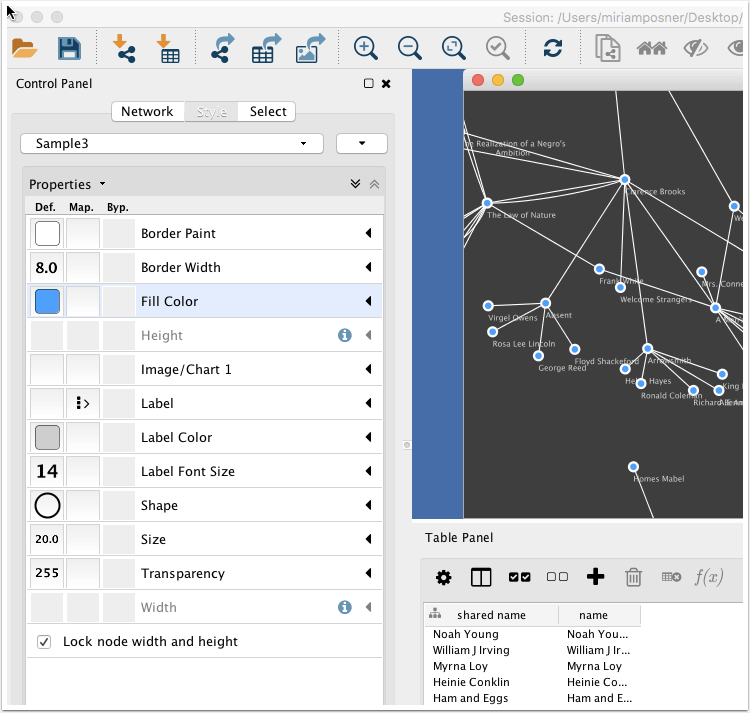
You can make changes to many visual attributes of your network graph from Cytoscape's control panel. Once you've selected the Style tab, look at the bottom of the control panel. You'll see that three additional buttons allow you to customize the look of the nodes, the edges, and the network as a whole.
Looking at the Node style pane, you'll see that we can alter many aspects of our nodes, including their border, the color, height, labels, etc. But what do the three columns, labeled Def., Map., and Byp. mean?
Def. stands for default: the default visual attribute of a node. If you click on the default fill color for your network diagram, for example (in the image below, it's a blue square), you'll see that you can swap out the colors of your network's nodes.
Byp. stands for bypass, and it allows you to apply a style to a group of nodes that you select.
The Map. (mapping) column allows you to control the visual features of your nodes according to their properties. For example, let's say you'd like all of the films from a particular studio to appear in pink. You can do that by mapping that attribute to a particular color. Or, let's say you'd like those nodes with more connections to appear larger. You can do that with the mapping control.
The problem is, we don't have any of that information currently included in our network. So in the next tutorial, we'll look at how to load up attributes for our nodes.
(Or you can skip straight to publishing your network diagram!)